Last updated: 2020-02-07

Checks: 7 0

Knit directory: BUSpaRse_notebooks/

This reproducible R Markdown analysis was created with workflowr (version 1.6.0). The Checks tab describes the reproducibility checks that were applied when the results were created. The Past versions tab lists the development history.


Great! Since the R Markdown file has been committed to the Git repository, you know the exact version of the code that produced these results.

Great job! The global environment was empty. Objects defined in the global environment can affect the analysis in your R Markdown file in unknown ways. For reproduciblity it’s best to always run the code in an empty environment.

The command set.seed(20181214) was run prior to running the code in the R Markdown file. Setting a seed ensures that any results that rely on randomness, e.g. subsampling or permutations, are reproducible.

Great job! Recording the operating system, R version, and package versions is critical for reproducibility.

Nice! There were no cached chunks for this analysis, so you can be confident that you successfully produced the results during this run.

Great job! Using relative paths to the files within your workflowr project makes it easier to run your code on other machines.

Great! You are using Git for version control. Tracking code development and connecting the code version to the results is critical for reproducibility. The version displayed above was the version of the Git repository at the time these results were generated.

Note that you need to be careful to ensure that all relevant files for the analysis have been committed to Git prior to generating the results (you can use wflow_publish or wflow_git_commit). workflowr only checks the R Markdown file, but you know if there are other scripts or data files that it depends on. Below is the status of the Git repository when the results were generated:


Ignored files:
    Ignored:    .Rhistory
    Ignored:    .Rproj.user/
    Ignored:    BUSpaRse_notebooks.Rproj
    Ignored:    MouseMineSynteny.blocks.gz
    Ignored:    NCBI_Human_forSynteny.gff3.gz
    Ignored:    data/fastqs/
    Ignored:    data/hgmm_100_fastqs.tar
    Ignored:    data/hgmm_1k_fastqs.tar
    Ignored:    data/hgmm_1k_v3_fastqs.tar
    Ignored:    data/hgmm_1k_v3_fastqs/
    Ignored:    data/hs_cdna.fa.gz
    Ignored:    data/hs_cdna96.fa.gz
    Ignored:    data/mm_cdna.fa.gz
    Ignored:    data/mm_cdna96.fa.gz
    Ignored:    data/mm_cdna97.fa.gz
    Ignored:    data/neuron_10k_v3_fastqs.tar
    Ignored:    data/neuron_10k_v3_fastqs/
    Ignored:    data/retina/
    Ignored:    data/whitelist_v2.txt
    Ignored:    data/whitelist_v3.txt
    Ignored:    output/hs_mm_tr_index.idx
    Ignored:    output/hs_mm_tr_index96.idx
    Ignored:    output/mm_cDNA_introns_97.idx
    Ignored:    output/mm_cDNA_introns_97_collapse.idx
    Ignored:    output/mm_tr_index.idx
    Ignored:    output/mm_tr_index97.idx
    Ignored:    output/out_hgmm1k2/
    Ignored:    output/out_hgmm1k_v3/
    Ignored:    output/out_retina/
    Ignored:    tmp/

Untracked files:
    Untracked:  .ipynb_checkpoints/
    Untracked:  SRR7244429_1.fastq
    Untracked:  SRR7244429_2.fastq
    Untracked:  analysis/dropseq_retina.Rmd
    Untracked:  analysis/ee_ie_junctions.Rmd
    Untracked:  analysis/junction.Rmd
    Untracked:  analysis/junction2.Rmd
    Untracked:  human_mouse_transcript_to_gene.tsv
    Untracked:  output/ee_ie/
    Untracked:  output/neuron10k/
    Untracked:  output/neuron10k_collapse/
    Untracked:  output/neuron10k_junction/
    Untracked:  output/neuron10k_velocity/
    Untracked:  output/out_hgmm1k/
    Untracked:  output/tr2g_hgmm.tsv
    Untracked:  output/tr2g_mm97.tsv
    Untracked:  problem5.ipynb
    Untracked:  test/

Unstaged changes:
    Modified:   analysis/monocle2.Rmd
    Deleted:    colab/.ipynb_checkpoints/10xv3-checkpoint.ipynb
    Deleted:    colab/.ipynb_checkpoints/Monocle 2-checkpoint.ipynb
    Deleted:    colab/.ipynb_checkpoints/Slingshot-checkpoint.ipynb
    Deleted:    colab/10xv3.ipynb
    Deleted:    colab/Mixed species (10x v2 chemistry).ipynb
    Deleted:    colab/Monocle 2.ipynb
    Deleted:    colab/Slingshot.ipynb

Note that any generated files, e.g. HTML, png, CSS, etc., are not included in this status report because it is ok for generated content to have uncommitted changes.


These are the previous versions of the R Markdown and HTML files. If you’ve configured a remote Git repository (see ?wflow_git_remote), click on the hyperlinks in the table below to view them.

File Version Author Date Message
Rmd a9f8930 Lambda Moses 2020-02-07 Don’t show SCTransform warnings
html 3655e91 Lambda Moses 2020-02-07 Build site.
Rmd 26a6c1b Lambda Moses 2020-02-07 Updated SingleR section
html 154f762 Lambda Moses 2020-01-18 Build site.
Rmd 5526f5a Lambda Moses 2020-01-18 OK, we do need a different index and bus file for velocity and just gene count
html db44e2e Lambda Moses 2020-01-18 Build site.
Rmd da56d19 Lambda Moses 2020-01-18 Updated wording to reflect that SingleR is on Bioconductor.
html 39e7b2b Lambda Moses 2019-09-13 Build site.
Rmd be4469c Lambda Moses 2019-09-13 Keep isoforms separate, also label clusters on velocity plots
html 5159d4a Lambda Moses 2019-09-06 Build site.
Rmd 0546e85 Lambda Moses 2019-09-06 Updated for the new version of BUSpaRse
html cba7dc4 Lambda Moses 2019-08-27 Build site.
Rmd 3312497 Lambda Moses 2019-08-27 To be consistent with velocyto
html 9b05bd3 Lambda Moses 2019-08-21 Build site.
Rmd 1a1b473 Lambda Moses 2019-08-21 Forgot to update a paragraph explaining bash code
html 84f0381 Lambda Moses 2019-08-21 Build site.
Rmd 85be0ed Lambda Moses 2019-08-21 Updated for bustools 0.39.3 and newer development version of Seurat
html c3fe4dc Lambda Moses 2019-07-25 Build site.
Rmd 9904300 Lambda Moses 2019-07-25 Stuff users won’t see, but saves me time
html e0ec72a Lambda Moses 2019-07-25 Build site.
Rmd 54e66d4 Lambda Moses 2019-07-25 Added phase portraits and fixed some embarrasingly wrong bash chunks.
Rmd 342b3bf Lambda Moses 2019-07-25 Reran with Ensembl 97, fixed embarrasingly wrong bash chunks, and added phase portraits
html a3abb12 Lambda Moses 2019-07-24 Build site.
Rmd 28b6ed4 Lambda Moses 2019-07-24 Changed the embarrasing title
html 22204f9 Lambda Moses 2019-07-24 Build site.
Rmd 1bd5af5 Lambda Moses 2019-07-24 RNA velocity tutorial

In this notebook, we perform RNA velocity analysis on the 10x 10k neurons from an E18 mouse. Instead of the velocyto command line tool, we will use the kallisto | bus pipeline, which is much faster than velocyto, to quantify spliced and unspliced transcripts.

Setup

If you would like to rerun this notebook, you can git clone this repository or directly download this notebook from GitHub.

Install packages

This notebook demonstrates the use of command line tools kallisto and bustools. Please use kallisto >= 0.46, whose binary can be downloaded here. Also, please use bustools >= 0.39.3, whose binary of bustools can be found here. User interface of bustools has changed in version 0.39.3. For version 0.39.2, see earlier git commits of this notebook.

After you download the binary, you should decompress the file (if it is tar.gz) with tar -xzvf file.tar.gz in the bash terminal, and add the directory containing the binary to PATH by export PATH=$PATH:/foo/bar, where /foo/bar is the directory of interest. Then you can directly invoke the binary on the command line as we will do in this notebook.

We will be using the R packages below. BUSpaRse is now on Bioconductor 3.10 (development version of Bioconductor). For Mac users, see the installation note for BUSpaRse. BUSpaRse will be used to generate the transcript to gene file for bustools and to read output of bustools into R. We will also use Seurat version 3 which is now on CRAN. Recently, Satija lab announced SeuratWrappers, with which we can run RNA velocity directly from Seurat. SeuratWrappers is also GitHub only at present. We need to install velocyto.R, which is GitHub only, to compute and visualize RNA velocity after quantifying spliced and unspliced transcripts.

# Install devtools if it's not already installed
if (!require(devtools)) {
  install.packages("devtools")
}
# Install from GitHub
devtools::install_github("BUStools/BUSpaRse")
devtools::install_github("satijalab/seurat-wrappers")
devtools::install_github("velocyto-team/velocyto.R")

This vignette uses the version of DropletUtils from Bioconductor version 3.10; the version from Bioconductor 3.8 has a different user interface. If you are using a version of R older than 3.6.0 and want to rerun this vignette, then you can adapt the knee plot code to the older version of DropletUtils, or install DropletUtils from GitHub, which I did for this notebook. BSgenome.Mmusculus.UCSC.mm10, AnnotationHub, SingleR are also on Bioconductor. Bioconductor packages can be installed as such:

if (!require(BiocManager)) {
  install.packages("BiocManager")
}
BiocManager::install(c("DropletUtils", "BSgenome.Mmusculus.UCSC.mm10", 
                       "AnnotationHub", "SingleR"))

The other packages are on CRAN.

library(BUSpaRse)
library(Seurat)
library(SeuratWrappers)
library(BSgenome.Mmusculus.UCSC.mm10)
library(AnnotationHub)
library(zeallot) # For %<-% that unpacks lists in the Python manner
library(DropletUtils)
library(tidyverse)
library(GGally) # For ggpairs
library(velocyto.R)
library(SingleR)
library(scales)
library(plotly)
theme_set(theme_bw())

Download data

The dataset we are using is 10x 10k neurons from an E18 mouse (almost 25 GB).

# Download data
if (!file.exists("./data/neuron_10k_v3_fastqs.tar")) {
  download.file("http://s3-us-west-2.amazonaws.com/10x.files/samples/cell-exp/3.0.0/neuron_10k_v3/neuron_10k_v3_fastqs.tar", "./data/neuron_10k_v3_fastqs.tar", method = "wget", quiet = TRUE)
}

Then untar the downloaded file.

cd ./data
tar -xvf ./neuron_10k_v3_fastqs.tar

Generate spliced and unspliced matrices

In order to know which reads come from spliced as opposed to unspliced transcripts, we need to see whether the reads contain intronic sequences. Thus we need to include intronic sequences in the kallisto index. This can be done with the BUSpaRse function get_velocity_files, which generates all files required to run RNA velocity with kallisto | bustools. First, we need a genome annotation to get intronic sequences. We can get genome annotation from GTF or GFF3 files from Ensembl with getGTF or getGFF from the R package biomartr, but Bioconductor provides genome annotations in its databases and package ecosystem as well. UCSC annotation can be obtained from Bioconductor package TxDb.Mmusculus.UCSC.mm10.knownGene. Here Ensembl version 97 is used, but Bioconductor 3.10 also provides version 98.

# query AnnotationHub for mouse Ensembl annotation
ah <- AnnotationHub()
snapshotDate(): 2019-10-29
query(ah, pattern = c("Ensembl", "97", "Mus musculus", "EnsDb"))
AnnotationHub with 1 record
# snapshotDate(): 2019-10-29 
# names(): AH73905
# $dataprovider: Ensembl
# $species: Mus musculus
# $rdataclass: EnsDb
# $rdatadateadded: 2019-05-02
# $title: Ensembl 97 EnsDb for Mus musculus
# $description: Gene and protein annotations for Mus musculus based on Ensem...
# $taxonomyid: 10090
# $genome: GRCm38
# $sourcetype: ensembl
# $sourceurl: http://www.ensembl.org
# $sourcesize: NA
# $tags: c("97", "AHEnsDbs", "Annotation", "EnsDb", "Ensembl", "Gene",
#   "Protein", "Transcript") 
# retrieve record with 'object[["AH73905"]]' 
# Get mouse Ensembl 97 annotation
edb <- ah[["AH73905"]]
loading from cache
require("ensembldb")

Explaining the arguments of get_velocity_files:

  • X, the genome annotation, which is here edb. Here edb is an EnsDb object. Other allowed inputs are: a path to a GTF file, a GRanges object made from loading a GTF file into R, or a TxDb object (e.g. TxDb.Mmusculus.UCSC.mm10.knownGene).
  • L: Length of the biological read of the technology of interest. For 10x v1 and v2 chemistry, L is 98 nt, and for v3 chemistry, L is 91 nt. The length of flanking region around introns is L-1, to capture reads from nascent transcripts that partially map to intronic and exonic sequences.
  • Genome: Genome, either a DNAStringSet or BSgenome object. Genomes of Homo sapiens and common model organisms can also be easily obtained from Bioconductor. The one used in this notebook is from the package BSgenome.Mmusculus.UCSC.mm10. Alternatively, you can download genomes from Ensembl, RefSeq, or GenBank with biomartr::getGenome. Make sure that the annotation and the genome use the same genome version, which is here GRCm38 (mm10).
  • Transcriptome: While you may supply a transcriptome in the form of a path to a fasta file or a DNAStringSet, this is not required. The transcriptome can be extracted from the genome with the gene annotation. We recommend extracting the transcriptome from the genome, so the transcript IDs used in the transcriptome and the annotation (and importantly, in the tr2g.tsv file, explained later) are guaranteed to match. In this notebook, the transcriptome is not supplied and will be extracted from the genome.
  • isoform_action: There are two options regarding gene isoforms from alternative splicing or alternative transcription start or termination site. One is to get intronic sequences separately for each isoform, and another is to collapse all isoforms of a gene by taking the union of all exonic ranges of the gene. To be honest, I implemented both options since I wasn’t sure which one is better. Now I reason that keeping isoforms separate is better, since given the way reads are assigned to “spliced” or “unspliced”, reads that are ambiguous due to alternative splicing will be discarded anyway and collapsing isoforms will inflate the counts in the spliced gene count matrices. Earlier versions of this notebook did collapse isoforms, so you can look at the previous version to compare results.
get_velocity_files(edb, L = 91, Genome = BSgenome.Mmusculus.UCSC.mm10, 
                   out_path = "./output/neuron10k_velocity", 
                   isoform_action = "separate")

For regular gene count data, we build a kallisto index for cDNAs as reads are pseudoaligned to cDNAs. Here, for RNA velocity, as reads are pseudoaligned to the flanked intronic sequences in addition to the cDNAs, the flanked intronic sequences should also be part of the kallisto index. We advise you to run this step on a server, as it takes up to about 50 GB of memory and takes about an hour to run.

# Intron index
kallisto index -i ./output/mm_cDNA_introns_97.idx ./output/neuron10k_velocity/cDNA_introns.fa

Using the kb wrapper

With kallisto and bustools, it takes several commands to go from fastq files to the spliced and unspliced matrices, which is quite cumbersome. So a wrapper called kb was written to condense those steps to one. The command line tool kb can be installed with

pip install kb-python

Then we can use the following command to generate the spliced and unspliced matrices:

cd ./output/neuron10k_velocity
kb count -i ../mm_cDNA_introns_97.idx -g tr2g.tsv -x 10xv3 -o kb \
-c1 cDNA_tx_to_capture.txt -c2 introns_tx_to_capture.txt --lamanno \
../../data/neuron_10k_v3_fastqs/neuron_10k_v3_S1_L002_R1_001.fastq.gz \
../../data/neuron_10k_v3_fastqs/neuron_10k_v3_S1_L002_R2_001.fastq.gz \
../../data/neuron_10k_v3_fastqs/neuron_10k_v3_S1_L001_R1_001.fastq.gz \
../../data/neuron_10k_v3_fastqs/neuron_10k_v3_S1_L001_R2_001.fastq.gz

The mtx files are in the counts_unfiltered directory.

Read the next section for instructions of going from fastq files to the matrices directly with kallisto and bustools. This is helpful to modularize the workflow. The matrices used in this notebook were generated in the next section.

Directly using kallisto and bustools

The initial bus file is generated the same way as in regular gene count data, except with the cDNA + flanked intron index.

cd ./data/neuron_10k_v3_fastqs
kallisto bus -i ../../output/mm_cDNA_introns_97.idx \
-o ../../output/neuron10k_velocity -x 10xv3 -t8 \
neuron_10k_v3_S1_L002_R1_001.fastq.gz neuron_10k_v3_S1_L002_R2_001.fastq.gz \
neuron_10k_v3_S1_L001_R1_001.fastq.gz neuron_10k_v3_S1_L001_R2_001.fastq.gz

The most recent version of BUSpaRse ensures that all transcripts on the capture list are present in the transcriptome. Otherwise the output of bustools capture will be wrong. I hope that this will be fixed soon or will get a helpful error message.

A barcode whitelist of all valid barcode can be used, though is not strictly required. The 10x whitelist contains all barcodes from the kit. The 10x whitelist file comes with Cell Ranger installation, and is copies to the working directory of this notebook. For bustools, the whitelist must be a text file with one column, each row of which is a valid cell barcode. The text file must not be compressed. If you do not have a whitelist, the most recent version of bustools can generate one based on data. The bustools whitelist command can also remove barcodes with too few reads, which means removing what may be empty droplets.

cp ~/cellranger-3.0.2/cellranger-cs/3.0.2/lib/python/cellranger/barcodes/3M-february-2018.txt.gz \
./data/whitelist_v3.txt.gz
# Decompress
gunzip ./data/whitelist_v3.txt.gz

The bustools correct command checks the whitelist and can correct some barcodes not on the whitelist but might have been due to sequencing error or mutation. If you do not wish to use a whitelist, then you can skip bustools correct below and go straight to bustools sort. In bash, | is a pipe just like the magrittr pipe %>% in R. The - by the end of the bustools sort command indicates where what goes through the pipe goes, i.e. the output of bustools correct is becoming the input to bustools sort. -t4 means using 4 threads.

The bustools capture command determines what is from cDNA and what is from the flanked introns and generate two separate bus files. The -s flag specifies that transcripts are to be captured; bustools capture also supports barcodes (-b) and UMIs (-u). To be consistent with velocyto, here “spliced” reads are those not mapping to any flanked intronic regions (so can’t be spanning intron-exon junctions), and “unspliced” reads are those not mapping to any exclusively exonic regions. The -x flag is used to find the complement of the capture list (which is the argument to -c), so the complement to the intronic list gives us the “spliced” reads from the above criterion, and the complement to the exonic list gives us the “unspliced” reads from the above criterion. This operates at the read or bus record level rather than the UMI or transcript level; the first bustools capture command (for spliced matrix) only cares whether a UMI for a barcode has a read that only maps to exonic sequences, counting it as spliced, but the command does not care if that same UMI has another read that only maps to intronic sequences, which is evidence that the transcript represented by that UMI is actually not fully spliced. That’s why I think this method counts some transcripts that in fact have intronic sequences as spliced, thus inflating the counts in the spliced matrix. Transcripts that are not fully spliced – whether nascent transcripts or transcripts with retained introns – do still have exons and even exon-exon junctions, as splicing is concurrent with transcriptions and usually not all introns are retained.

cd ./output/neuron10k_velocity
bustools correct -w ../../data/whitelist_v3.txt -p output.bus | \
bustools sort -o output.correct.sort.bus -t4 -
bustools capture -s -x -o spliced.bus -c ./introns_tx_to_capture.txt -e matrix.ec -t transcripts.txt output.correct.sort.bus
bustools capture -s -x -o unspliced.bus -c ./cDNA_tx_to_capture.txt -e matrix.ec -t transcripts.txt output.correct.sort.bus

Unlike for just a gene count matrix, for RNA velocity, 2 matrices are generated. One for spliced transcripts, and the other for unspliced.

cd ./output/neuron10k_velocity
bustools count -o unspliced -g ./tr2g.tsv -e matrix.ec -t transcripts.txt --genecounts unspliced.bus
bustools count -o spliced -g ./tr2g.tsv -e matrix.ec -t transcripts.txt --genecounts spliced.bus

Preprocessing

Remove empty droplets

Now we have the spliced and unspliced matrices to be read into R:

d <- "./output/neuron10k_velocity"
c(spliced, unspliced) %<-% read_velocity_output(spliced_dir = d,
                                                spliced_name = "spliced",
                                                unspliced_dir = d,
                                                unspliced_name = "unspliced")

The %<-% from zeallot unpacks a list of 2 into 2 separate objects in the Python and Matlab manner. How many UMIs are from unspliced transcripts?

sum(unspliced@x) / (sum(unspliced@x) + sum(spliced@x))
[1] 0.4114184

In previous versions of this notebook, there were more unspliced counts than spliced counts. As part of an ongoing project, I converted the supposedly unspliced bus output into text and inspected it in R as a data frame. The output was wrong; there were still reads mapped to exclusively exonic regions in that bus file. However, the problem was fixed when I made sure that all transcripts in the capture list are also in the transcript list in the kallisto bus output, so the current version should be correct. However, this is still a higher proportion of unspliced counts. In contrast, for velocyto, the unspliced count is usually between 10% and 20% of the sum of spliced and unspliced. Perhaps this is because kallisto | bus counts reads that are partially intronic and partially exonic as unspliced while velocyto throws away many reads (see this GitHub issue).

We expect around 10,000 cells. There are over 10 times more barcodes here, since most barcodes are from empty droplets. The number of genes does not seem too outrageous.

dim(spliced)
[1]   55487 1134440
dim(unspliced)
[1]  55487 723864

Most barcodes only have 0 or 1 UMIs detected.

tot_count <- Matrix::colSums(spliced)
summary(tot_count)
    Min.  1st Qu.   Median     Mean  3rd Qu.     Max. 
    0.00     1.00     1.00    61.86     2.00 43938.00 

A commonly used method to estimate the number of empty droplets is barcode ranking knee and inflection points, as those are often assumed to represent transition between two components of a distribution. While more sophisticated methods exist (e.g. see emptyDrops in DropletUtils), for simplicity, we will use the barcode ranking method here. However, whichever way we go, we don’t have the ground truth. The spliced matrix is used for filtering, though both matrices have similar inflection points.

bc_rank <- barcodeRanks(spliced)
bc_uns <- barcodeRanks(unspliced)

Here the knee plot is transposed, because this is more generalizable to multi-modal data, such that those with not only RNA-seq but also abundance of cell surface markers. In that case, we can plot number of UMIs on the x axis, number of cell surface protein tags on the y axis, and barcode rank based on both UMI and protein tag counts on the z axis; it makes more sense to make barcode rank the dependent variable. See this blog post by Lior Pachter for a more detailed explanation.

#' Knee plot for filtering empty droplets
#' 
#' Visualizes the inflection point to filter empty droplets. This function plots 
#' different datasets with a different color. Facets can be added after calling
#' this function with `facet_*` functions.
#' 
#' @param bc_ranks A named list of output from `DropletUtil::barcodeRanks`.
#' @return A ggplot2 object.
#' @importFrom tibble tibble
#' @importFrom purrr map map_dbl
#' @importFrom dplyr distinct
#' @importFrom ggplot2 geom_line geom_hline geom_vline scale_x_log10 scale_y_log10
#' @importFrom tidyr unnest
#' @export
knee_plot <- function(bc_ranks) {
  # purrr pluck shorthand doesn't work on S4Vector DataFrame
  knee_plt <- tibble(rank = map(bc_ranks, ~ .x[["rank"]]), 
                     total = map(bc_ranks, ~ .x[["total"]]),
                     dataset = names(bc_ranks)) %>% 
    unnest(cols = c(rank, total)) %>% 
    distinct() %>% 
    dplyr::filter(total > 0)
  annot <- tibble(inflection = map_dbl(bc_ranks, ~ metadata(.x)[["inflection"]]),
                  rank_cutoff = map_dbl(bc_ranks, 
                                        ~ max(.x$rank[.x$total >
                                                        metadata(.x)[["inflection"]]])),
                  dataset = names(bc_ranks))
  p <- ggplot(knee_plt, aes(rank, total, color = dataset)) +
    geom_line() +
    geom_hline(aes(yintercept = inflection, color = dataset), 
               data = annot, linetype = 2) +
    geom_vline(aes(xintercept = rank_cutoff, color = dataset),
               data = annot, linetype = 2) +
    scale_x_log10() +
    scale_y_log10() +
    labs(x = "Rank", y = "Total UMIs")
  return(p)
}
knee_plot(list(spliced = bc_rank, unspliced = bc_uns)) +
  coord_flip()

Version Author Date
db44e2e Lambda Moses 2020-01-18
39e7b2b Lambda Moses 2019-09-13
5159d4a Lambda Moses 2019-09-06
cba7dc4 Lambda Moses 2019-08-27
84f0381 Lambda Moses 2019-08-21
e0ec72a Lambda Moses 2019-07-25
22204f9 Lambda Moses 2019-07-24

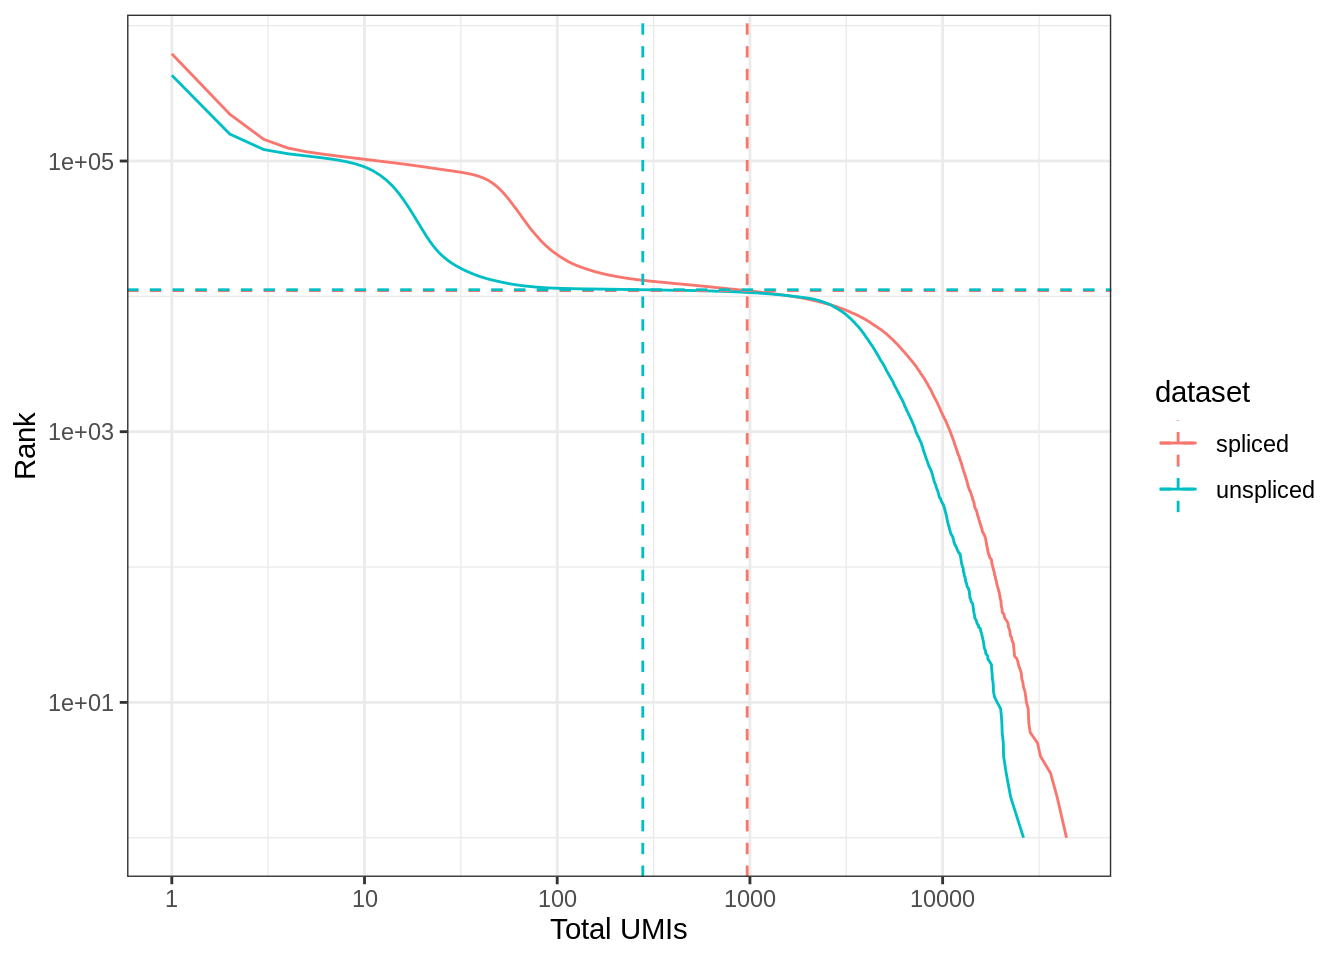
Which inflection point should be used to remove what are supposed to be empty droplets? The one of the spliced matrix or the unspliced matrix?

Actually, spliced and unspliced counts are multimodal data, so why not make one of those promised 3D plots where the barcode rank depends on two variables? The rank (z axis) would now be the number cells with at least x spliced UMIs and y unspliced UMIs. How shall this be computed? The transposed knee plot (or rank-UMI plot) can be thought of as (1 - ECDF(total_UMI))*n_cells. In the ECDF of total UMI counts, the dependent variable is the proportion of cells with at most this number of distinct UMIs. So 1 minus that would mean the proportion of cells with at least this number of distinct UMIs. In the knee plot, the rank is the number of cells with at least this number of distinct UMIs. So dividing by the number of cells, we get 1 - ECDF(total_UMI). Would computing the 2D ECDF be more efficient than this naive approach? There is an R package that can compute bivariate ECDFs called Emcdf, but it uses so much memory that even our server can’t handle. I failed to find implementations of bivariate ECDFs in other languages. There is an algorithm based on range trees that can find multivariate ECDF efficiently.

Before obtaining a more efficient implementation, I used my naive approach that translates this concept into code very literally. Though I used Rcpp, it’s really slow. The trick to make it faster is to only evaluate how many cells have at least x spliced and y unspliced counts at a smaller number of grid points of x and y.

//[[Rcpp::depends(RcppProgress)]]
#include <progress.hpp>
#include <progress_bar.hpp>
#include <Rcpp.h>
using namespace Rcpp;

//[[Rcpp::export]]
NumericMatrix bc_ranks2(NumericVector x, NumericVector y, 
                        NumericVector x_grid, NumericVector y_grid) {
  NumericMatrix out(x_grid.size(), y_grid.size());
  Progress p(x_grid.size(), true);
  for (int i = 0; i < x_grid.size(); i++) {
    checkUserInterrupt();
    for (int j = 0; j < y_grid.size(); j++) {
      out(i,j) = sum((x_grid[i] <= x) & (y_grid[j] <= y));
    }
    p.increment();
  }
  return(out);
}

As most barcodes have a small number of distinct UMIs detected, the grid should be denser for fewer counts. Making the grid in log space achieves this.

# Can only plot barcodes with both spliced and unspliced counts
bcs_inter <- intersect(colnames(spliced), colnames(unspliced))
s <- colSums(spliced[,bcs_inter])
u <- colSums(unspliced[,bcs_inter])
# Grid points
sr <- sort(unique(exp(round(log(s)*100)/100)))
ur <- sort(unique(exp(round(log(u)*100)/100)))
# Run naive approach
bc2 <- bc_ranks2(s, u, sr, ur)

What would the “rank” look like?

# can't turn color to lot scale unless log values are plotted
z_use <- log10(bc2)
z_use[is.infinite(z_use)] <- NA
plot_ly(x = sr, y = ur, z = z_use) %>% add_surface() %>% 
  layout(scene = list(xaxis = list(title = "Total spliced UMIs", type = "log"),
                      yaxis = list(title = "Total unspliced UMIs", type = "log"),
                      zaxis = list(title = "Rank (log10)")))

Looks like it worked. This looks pretty symmetric as the rank-UMI plots for the spliced and unspliced matrices are pretty similar. How can this be used to decide what may be empty droplets? This worths some more thoughts. The surface might also need to be be smoothed for automated thresholding, just like in DropletUtils’s inflection method. For now, for simplicity, the inflection point for the spliced matrix will be used provisionally.

bcs_use <- colnames(spliced)[tot_count > metadata(bc_rank)$inflection]
# Remove genes that aren't detected
tot_genes <- Matrix::rowSums(spliced)
genes_use <- rownames(spliced)[tot_genes > 0]
sf <- spliced[genes_use, bcs_use]
uf <- unspliced[genes_use, bcs_use]
dim(sf)
[1] 24457 11024
rownames(sf) <- str_remove(rownames(sf), "\\.\\d+")
rownames(uf) <- str_remove(rownames(uf), "\\.\\d+")

Cell type annotation

SingleR uses bulk RNA-seq data of isolated known cell types as a reference to annotate cell types in scRNA-seq datasets. The reference uses Ensembl IDs without version number.

seu <- CreateSeuratObject(sf, assay = "sf") %>% 
  SCTransform(assay = "sf", new.assay.name = "spliced")
Calculating cell attributes for input UMI matrix
Variance stabilizing transformation of count matrix of size 18225 by 11024
Model formula is y ~ log_umi
Get Negative Binomial regression parameters per gene
Using 2000 genes, 11024 cells
Found 24 outliers - those will be ignored in fitting/regularization step
Second step: Get residuals using fitted parameters for 18225 genes
Computing corrected count matrix for 18225 genes
Calculating gene attributes
Wall clock passed: Time difference of 4.683055 mins
Determine variable features
Set 3000 variable features
Place corrected count matrix in counts slot
Centering data matrix
Set default assay to spliced

This is the reference that contains mouse brain cell types.

mouse.rnaseq <- MouseRNAseqData(ensembl = TRUE)
snapshotDate(): 2019-10-22
see ?SingleR and browseVignettes('SingleR') for documentation
loading from cache
see ?SingleR and browseVignettes('SingleR') for documentation
loading from cache
snapshotDate(): 2019-10-29
loading from cache
Warning: Unable to map 2180 of 21214 requested IDs.
annots <- SingleR(GetAssayData(seu, assay = "spliced", slot = "data"), 
                  ref = mouse.rnaseq, labels = colData(mouse.rnaseq)$label.fine,
                  de.method = "wilcox", method = "single", BPPARAM = MulticoreParam(4))

In order not to have cells not of the neural or glial lineages overshadow velocity visualization, only cells of the neural and glial lineages are kept.

inds <- annots$pruned.labels %in% c("NPCs", "Neurons", "OPCs", "Oligodendrocytes", 
                                    "qNSCs", "aNSCs", "Astrocytes", "Ependymal")
# Only keep these cell types
cells_use <- row.names(annots)[inds]
seu <- seu[, cells_use]
seu$cell_type <- annots$pruned.labels[inds]

Meaning of the acronyms:

  • NPCs: Neural progenitor cells
  • OPCs: Oligodendrocyte progenitor cells
  • qNSCs: Quiescent neural stem cells
  • aNSCs: Active neural stem cells
# Also only keep relevant cell types in the unspliced matrix
uf <- uf[, cells_use]

QC

Both the spliced and unspliced matrices are normalized and scaled with SCTransform, which is an alternative to NormalizeData, ScaleData, and FindVariableFeatures.

seu[["uf"]] <- CreateAssayObject(uf)
seu <- SCTransform(seu, assay = "uf", new.assay.name = "unspliced")
Calculating cell attributes for input UMI matrix
Variance stabilizing transformation of count matrix of size 16412 by 10658
Model formula is y ~ log_umi
Get Negative Binomial regression parameters per gene
Using 2000 genes, 10658 cells
Found 20 outliers - those will be ignored in fitting/regularization step
Second step: Get residuals using fitted parameters for 16412 genes
Computing corrected count matrix for 16412 genes
Calculating gene attributes
Wall clock passed: Time difference of 4.300282 mins
Determine variable features
Set 3000 variable features
Place corrected count matrix in counts slot
Centering data matrix
Set default assay to unspliced
cols_use <- c("nCount_sf", "nFeature_sf", "nCount_uf", "nFeature_uf")
VlnPlot(seu, cols_use, pt.size = 0.1, ncol = 1, group.by = "cell_type")

Version Author Date
3655e91 Lambda Moses 2020-02-07

There’s only 1 cell labeled ependymal by SingleR. How does number of UMI counts relate to number of genes detected? How does number of UMI counts in the spliced matrix relate to the number of gene detected in the unspliced matrix?

# Helper functions for ggpairs
log10_diagonal <- function(data, mapping, ...) {
  ggally_densityDiag(data, mapping, ...) + scale_x_log10()
}
log10_points <- function(data, mapping, ...) {
  ggally_points(data, mapping, ...) + scale_x_log10() + scale_y_log10()
}
ggpairs(seu@meta.data, columns = cols_use,
        upper = list(continuous = "cor"),
        diag = list(continuous = log10_diagonal),
        lower = list(continuous = wrap(log10_points, alpha = 0.1, size=0.3)),
        progress = FALSE)

Version Author Date
3655e91 Lambda Moses 2020-02-07
39e7b2b Lambda Moses 2019-09-13
5159d4a Lambda Moses 2019-09-06
cba7dc4 Lambda Moses 2019-08-27
84f0381 Lambda Moses 2019-08-21
e0ec72a Lambda Moses 2019-07-25
22204f9 Lambda Moses 2019-07-24

Dimension reduction

When visualizing RNA velocity on reduced dimensions, should the cell embeddings be from the spliced matrix or the unspliced matrix or the sum of both? In my opinion, it makes the most sense to plot RNA velocity over cell embeddings from the spliced matrix. The arrows in RNA velocity visualization stand for where the cell is predicted to be going in the near future. Where does the cell go from? The current state. And the current state is represented by the spliced matrix, while the unspliced matrix represents what is soon to come. Thus all the dimension reduction here will be computed from the spliced matrix.

DefaultAssay(seu) <- "spliced"
seu <- RunPCA(seu, verbose = FALSE, npcs = 70)
ElbowPlot(seu, ndims = 70)

Version Author Date
3655e91 Lambda Moses 2020-02-07
39e7b2b Lambda Moses 2019-09-13
5159d4a Lambda Moses 2019-09-06
cba7dc4 Lambda Moses 2019-08-27
84f0381 Lambda Moses 2019-08-21
e0ec72a Lambda Moses 2019-07-25
22204f9 Lambda Moses 2019-07-24
# Need to use DimPlot due to weird workflowr problem with PCAPlot that calls seu[[wflow.build]]
# and eats up memory. I suspect this is due to the sys.call() in 
# Seurat:::SpecificDimPlot. 
DimPlot(seu, reduction = "pca",
        group.by = "cell_type", pt.size = 0.5, label = TRUE, repel = TRUE) +
  scale_color_brewer(type = "qual", palette = "Set2")
Warning: Using `as.character()` on a quosure is deprecated as of rlang 0.3.0.
Please use `as_label()` or `as_name()` instead.
This warning is displayed once per session.

Version Author Date
3655e91 Lambda Moses 2020-02-07
39e7b2b Lambda Moses 2019-09-13
5159d4a Lambda Moses 2019-09-06
cba7dc4 Lambda Moses 2019-08-27
84f0381 Lambda Moses 2019-08-21
e0ec72a Lambda Moses 2019-07-25
22204f9 Lambda Moses 2019-07-24
seu <- RunTSNE(seu, dims = 1:50, verbose = FALSE)
DimPlot(seu, reduction = "tsne",
        group.by = "cell_type", pt.size = 0.5, label = TRUE, repel = TRUE) +
  scale_color_brewer(type = "qual", palette = "Set2")

Version Author Date
3655e91 Lambda Moses 2020-02-07
39e7b2b Lambda Moses 2019-09-13
5159d4a Lambda Moses 2019-09-06
cba7dc4 Lambda Moses 2019-08-27
84f0381 Lambda Moses 2019-08-21
e0ec72a Lambda Moses 2019-07-25
22204f9 Lambda Moses 2019-07-24

This looks quite similar to the tSNE from gene count matrix of this same dataset, except rotated; see the slingshot notebook

In the current CRAN version of Seurat, RunUMAP can use the R package uwot as the backend, thus obliterating the need to call Python UMAP through reticulate. On servers, reticulate does not work due to this issue.

seu <- RunUMAP(seu, dims = 1:50, umap.method = "uwot")
Warning: The default method for RunUMAP has changed from calling Python UMAP via reticulate to the R-native UWOT using the cosine metric
To use Python UMAP via reticulate, set umap.method to 'umap-learn' and metric to 'correlation'
This message will be shown once per session
21:44:58 UMAP embedding parameters a = 0.9922 b = 1.112
21:44:58 Read 10658 rows and found 50 numeric columns
21:44:58 Using Annoy for neighbor search, n_neighbors = 30
21:44:58 Building Annoy index with metric = cosine, n_trees = 50
0%   10   20   30   40   50   60   70   80   90   100%
[----|----|----|----|----|----|----|----|----|----|
**************************************************|
21:45:00 Writing NN index file to temp file /tmp/RtmpPdSvv3/file187f64531fe91
21:45:00 Searching Annoy index using 1 thread, search_k = 3000
21:45:03 Annoy recall = 100%
21:45:04 Commencing smooth kNN distance calibration using 1 thread
21:45:07 Initializing from normalized Laplacian + noise
21:45:07 Commencing optimization for 200 epochs, with 438324 positive edges
21:45:18 Optimization finished
DimPlot(seu, reduction = "umap",
        group.by = "cell_type", pt.size = 0.5, label = TRUE, repel = TRUE) +
  scale_color_brewer(type = "qual", palette = "Set2")

Version Author Date
3655e91 Lambda Moses 2020-02-07
db44e2e Lambda Moses 2020-01-18
39e7b2b Lambda Moses 2019-09-13
5159d4a Lambda Moses 2019-09-06
cba7dc4 Lambda Moses 2019-08-27
84f0381 Lambda Moses 2019-08-21
e0ec72a Lambda Moses 2019-07-25
22204f9 Lambda Moses 2019-07-24

As expected, one end has mostly stem cells, and the other end has mostly neurons. Clustering should partition the big blob of NPCs that SingleR could not further partition due to limitations in the SingleR reference for mouse brains.

seu <- FindNeighbors(seu, verbose = FALSE) %>% 
  FindClusters(resolution = 1, verbose = FALSE) # Louvain
DimPlot(seu, pt.size = 0.5, reduction = "umap", label = TRUE)

Version Author Date
3655e91 Lambda Moses 2020-02-07
db44e2e Lambda Moses 2020-01-18
39e7b2b Lambda Moses 2019-09-13
5159d4a Lambda Moses 2019-09-06
cba7dc4 Lambda Moses 2019-08-27
84f0381 Lambda Moses 2019-08-21
e0ec72a Lambda Moses 2019-07-25
22204f9 Lambda Moses 2019-07-24

RNA velocity

seu <- RunVelocity(seu, ncores = 10, reduction = "pca", verbose = FALSE)

Unfortunately, velocyto.R does not natively support ggplot2. This is a function that assigns colors to each cell in base R graphics.

cell_pal <- function(cell_cats, pal_fun) {
  categories <- sort(unique(cell_cats))
  pal <- setNames(pal_fun(length(categories)), categories)
  pal[cell_cats]
}

It would also be helpful to label the clusters.

#' Get cluster label coordinates
#' 
#' @param labels Character or factor vector for labels.
#' @param coords Numeric matrix with two columns, for x and y coordinates of the dimension reduction; the number of rows must match the length of `labels`.
#' @param ... Extra arguments passed to `text`.
#' @return Nothing. Just adds text labels to the plot if the plotting device is still on.
label_clusters <- function(labels, coords, ...) {
  df <- tibble(label = labels, x = coords[,1], y = coords[,2])
  df <- df %>% 
    group_by(label) %>% 
    summarize(x = median(x), y = median(y))
  text(df$x, df$y, df$label, ...)
}

velocyto.R also requires that the vector of colors should have cell barcodes/IDs as names to match color to cell.

cell_colors <- cell_pal(seu$cell_type, brewer_pal("qual", "Set2"))
cell_colors_clust <- cell_pal(seu$seurat_clusters, hue_pal())
names(cell_colors) <- names(cell_colors_clust) <- Cells(seu)

Would a clean trajectory from qNSCs to NPCs to neurons be traced? The arrows are projected onto non-linear dimension reductions by correlation between the predicted cell state and gene expression of other cells in the dataset. The downside of this approach is that cells at end points of the trajectories point backwards, which is really confusing.

cc_umap <- show.velocity.on.embedding.cor(emb = Embeddings(seu, "umap"),
                                          vel = Tool(seu, slot = "RunVelocity"),
                                          n.cores = 50, show.grid.flow = TRUE,
                                          grid.n = 50, cell.colors = cell_colors,
                                          cex = 0.5, cell.border.alpha = 0,
                                          arrow.scale = 2, arrow.lwd = 0.6,
                                          xlab = "UMAP1", ylab = "UMAP2")
label_clusters(seu$cell_type, Embeddings(seu, "umap"), font = 2, col = "brown")
knn ... transition probs ... done
calculating arrows ... done
grid estimates ... grid.sd= 0.2845819  min.arrow.size= 0.005691639  max.grid.arrow.length= 0.03662748  done

Version Author Date
3655e91 Lambda Moses 2020-02-07
db44e2e Lambda Moses 2020-01-18
39e7b2b Lambda Moses 2019-09-13
5159d4a Lambda Moses 2019-09-06
cba7dc4 Lambda Moses 2019-08-27
84f0381 Lambda Moses 2019-08-21
c3fe4dc Lambda Moses 2019-07-25
e0ec72a Lambda Moses 2019-07-25
22204f9 Lambda Moses 2019-07-24

This presents a much more complicated picture. The cells labeled qNSCs and astrocytes are at the very top, going into two paths, one going down and to the right to the neurons, and the other going left towards the OPCs. There also seems to be a cycle to the left of what’s labeled qNSCs and astrocytes at the top. To the lower right of the cluster containing what’s labeled OPCs (cluster 7), there’re two branches, but those also look like a cycle. In the slingshot notebook, I did get a lineage that departs on one of the branches near OPCs and returns on the other (curve 13); the RNA velocity velocity results here seems to support the existence of that lineage. The more mature neurons also seem to be changing a lot; they seem to branch into 3 different populations. More detailed manual cell type annotation would be helpful.

This step is computationally expensive; in subsequent calls to show.velocity.on.embedding.cor for the same dimension reduction, the expensive part can be bypassed by supplying the output of the first call.

show.velocity.on.embedding.cor(emb = Embeddings(seu, "umap"),
                               vel = Tool(seu, slot = "RunVelocity"),
                               n.cores = 50, show.grid.flow = TRUE,
                               grid.n = 50, cell.colors = cell_colors_clust,
                               cex = 0.5, cell.border.alpha = 0,
                               arrow.scale = 2, arrow.lwd = 0.6, 
                               cc = cc_umap$cc,
                               xlab = "UMAP1", ylab = "UMAP2")
knn ... transition probs ... done
calculating arrows ... done
grid estimates ... grid.sd= 0.2845819  min.arrow.size= 0.005691639  max.grid.arrow.length= 0.03662748  done
legend("topleft", legend = unique(seu$cell_type),
       col = unique(cell_colors), pch = 16, box.lwd = 0)
label_clusters(seu$seurat_clusters, Embeddings(seu, "umap"), font = 2, cex = 1.2)

Version Author Date
3655e91 Lambda Moses 2020-02-07
db44e2e Lambda Moses 2020-01-18
39e7b2b Lambda Moses 2019-09-13
5159d4a Lambda Moses 2019-09-06
cba7dc4 Lambda Moses 2019-08-27
84f0381 Lambda Moses 2019-08-21
e0ec72a Lambda Moses 2019-07-25
22204f9 Lambda Moses 2019-07-24

qNSCs and closely related astrocytes are in cluster 10.

Phase portraits

# Get gene names
gns <- tr2g_EnsDb(edb, use_gene_version = FALSE)[,c("gene", "gene_name")] %>% 
  distinct()

Let’s look at phase portraits of some genes:

gene.relative.velocity.estimates(GetAssayData(seu, slot = "data", assay = "spliced"),
                                 GetAssayData(seu, slot = "data", assay = "unspliced"),
                                 cell.emb = Embeddings(seu, "umap"),
                                 show.gene = gns$gene[gns$gene_name == "Mef2c"],
                                 old.fit = Tool(seu, slot = "RunVelocity"),
                                 cell.colors = cell_colors)
calculating convolved matrices ... done

Version Author Date
3655e91 Lambda Moses 2020-02-07
db44e2e Lambda Moses 2020-01-18
39e7b2b Lambda Moses 2019-09-13
5159d4a Lambda Moses 2019-09-06
cba7dc4 Lambda Moses 2019-08-27
84f0381 Lambda Moses 2019-08-21
e0ec72a Lambda Moses 2019-07-25
[1] 1

This is Mef2c (myocyte enhancer factor 2C), which is highly expressed in the mouse adult cortex though not much in the embryonic CNS until E18, according to the NCBI page of this gene. In this dataset, it’s more highly expressed among a subset of cells labeled neurons and those close to those neurons. However, it seems that it’s close to steady state (the line in panel 3, the phase portrait); in most cells there aren’t much more or fewer unspliced than spliced transcripts, but it seems to be below steady state for neurons, meaning that the gene is downregulated in those cells.

gene.relative.velocity.estimates(GetAssayData(seu, slot = "data", assay = "spliced"),
                                 GetAssayData(seu, slot = "data", assay = "unspliced"),
                                 cell.emb = Embeddings(seu, "umap"),
                                 show.gene = gns$gene[gns$gene_name == "Fabp7"],
                                 old.fit = Tool(seu, slot = "RunVelocity"),
                                 cell.colors = cell_colors)
calculating convolved matrices ... done

Version Author Date
3655e91 Lambda Moses 2020-02-07
db44e2e Lambda Moses 2020-01-18
39e7b2b Lambda Moses 2019-09-13
5159d4a Lambda Moses 2019-09-06
cba7dc4 Lambda Moses 2019-08-27
84f0381 Lambda Moses 2019-08-21
e0ec72a Lambda Moses 2019-07-25
[1] 1

This is Fabp7 (fatty acid binding protein 7). It’s highly expressed in the mouse embryonic CNS, though much less so in adult CNS, according to the NCBI page of this gene. In this dataset, it’s highly expressed in the cells close to qNSCs, i.e. those in earlier stages of differentiation. The line in the third panel representing the steady state was fitted with the lower and upper extremes of the plot in case of departure from steady state. Here we see many cells below the putative steady state, downregulated and with fewer unspliced transcripts than expected. The fourth panel is the residual of the fit in the third panel, with red for positive and blue for negative. It seems that some cells with many spliced counts for this gene has fewer than “steady state” counts of unspliced counts.

gene.relative.velocity.estimates(GetAssayData(seu, slot = "data", assay = "spliced"),
                                 GetAssayData(seu, slot = "data", assay = "unspliced"),
                                 cell.emb = Embeddings(seu, "umap"),
                                 show.gene = gns$gene[gns$gene_name == "Arpp21"],
                                 old.fit = Tool(seu, slot = "RunVelocity"),
                                 cell.colors = cell_colors)
calculating convolved matrices ... done

Version Author Date
3655e91 Lambda Moses 2020-02-07
db44e2e Lambda Moses 2020-01-18
39e7b2b Lambda Moses 2019-09-13
5159d4a Lambda Moses 2019-09-06
cba7dc4 Lambda Moses 2019-08-27
84f0381 Lambda Moses 2019-08-21
e0ec72a Lambda Moses 2019-07-25
[1] 1

This is Arpp21 (cyclic AMP-regulated phosphoprotein, 21), which according to ENCODE RNA-seq data, is increasingly expressed in the mouse CNS through development. Here most cells are above the line that is the putative steady state, meaning that this gene is upregulated, which is consistent with the ENCODE data.


sessionInfo()
R version 3.6.0 (2019-04-26)
Platform: x86_64-redhat-linux-gnu (64-bit)
Running under: CentOS Linux 7 (Core)

Matrix products: default
BLAS/LAPACK: /usr/lib64/R/lib/libRblas.so

locale:
[1] en_US.UTF-8

attached base packages:
[1] stats4    parallel  stats     graphics  grDevices utils     datasets 
[8] methods   base     

other attached packages:
 [1] ensembldb_2.10.2                   AnnotationFilter_1.10.0           
 [3] GenomicFeatures_1.38.1             AnnotationDbi_1.48.0              
 [5] plotly_4.9.1                       scales_1.1.0                      
 [7] SingleR_1.0.5                      velocyto.R_0.6                    
 [9] Matrix_1.2-18                      GGally_1.4.0                      
[11] forcats_0.4.0                      stringr_1.4.0                     
[13] dplyr_0.8.3                        purrr_0.3.3                       
[15] readr_1.3.1                        tidyr_1.0.2                       
[17] tibble_2.1.3                       ggplot2_3.2.1                     
[19] tidyverse_1.3.0                    DropletUtils_1.6.1                
[21] SingleCellExperiment_1.8.0         SummarizedExperiment_1.16.1       
[23] DelayedArray_0.12.2                BiocParallel_1.20.1               
[25] matrixStats_0.55.0                 Biobase_2.46.0                    
[27] zeallot_0.1.0                      AnnotationHub_2.18.0              
[29] BiocFileCache_1.10.2               dbplyr_1.4.2                      
[31] BSgenome.Mmusculus.UCSC.mm10_1.4.0 BSgenome_1.54.0                   
[33] rtracklayer_1.46.0                 Biostrings_2.54.0                 
[35] XVector_0.26.0                     GenomicRanges_1.38.0              
[37] GenomeInfoDb_1.22.0                IRanges_2.20.2                    
[39] S4Vectors_0.24.3                   BiocGenerics_0.32.0               
[41] SeuratWrappers_0.1.0               Seurat_3.1.2                      
[43] BUSpaRse_1.0.0                     workflowr_1.6.0                   

loaded via a namespace (and not attached):
  [1] rappdirs_0.3.1                R.methodsS3_1.7.1            
  [3] bit64_0.9-7                   knitr_1.27                   
  [5] irlba_2.3.3                   R.utils_2.9.2                
  [7] data.table_1.12.8             RCurl_1.98-1.1               
  [9] generics_0.0.2                metap_1.0                    
 [11] cowplot_1.0.0                 RSQLite_2.2.0                
 [13] RANN_2.6.1                    future_1.16.0                
 [15] bit_1.1-15.1                  xml2_1.2.2                   
 [17] lubridate_1.7.4               httpuv_1.5.2                 
 [19] assertthat_0.2.1              xfun_0.12                    
 [21] hms_0.5.3                     evaluate_0.14                
 [23] promises_1.1.0                fansi_0.4.1                  
 [25] progress_1.2.2                caTools_1.18.0               
 [27] readxl_1.3.1                  igraph_1.2.4.2               
 [29] DBI_1.1.0                     htmlwidgets_1.5.1            
 [31] reshape_0.8.8                 RSpectra_0.16-0              
 [33] crosstalk_1.0.0               backports_1.1.5              
 [35] gbRd_0.4-11                   RcppParallel_4.4.4           
 [37] biomaRt_2.42.0                vctrs_0.2.2                  
 [39] remotes_2.1.0                 ROCR_1.0-7                   
 [41] withr_2.1.2                   sctransform_0.2.1            
 [43] GenomicAlignments_1.22.1      prettyunits_1.1.1            
 [45] RcppProgress_0.4.1            cluster_2.1.0                
 [47] ExperimentHub_1.12.0          ape_5.3                      
 [49] lazyeval_0.2.2                crayon_1.3.4                 
 [51] labeling_0.3                  edgeR_3.28.0                 
 [53] pkgconfig_2.0.3               nlme_3.1-143                 
 [55] ProtGenerics_1.18.0           rlang_0.4.3                  
 [57] globals_0.12.5                lifecycle_0.1.0              
 [59] modelr_0.1.5                  rsvd_1.0.2                   
 [61] cellranger_1.1.0              rprojroot_1.3-2              
 [63] lmtest_0.9-37                 Rhdf5lib_1.8.0               
 [65] zoo_1.8-7                     reprex_0.3.0                 
 [67] whisker_0.4                   ggridges_0.5.2               
 [69] png_0.1-7                     viridisLite_0.3.0            
 [71] bitops_1.0-6                  R.oo_1.23.0                  
 [73] KernSmooth_2.23-16            blob_1.2.1                   
 [75] DelayedMatrixStats_1.8.0      memoise_1.1.0                
 [77] magrittr_1.5                  plyr_1.8.5                   
 [79] ica_1.0-2                     gplots_3.0.1.2               
 [81] bibtex_0.4.2.2                gdata_2.18.0                 
 [83] zlibbioc_1.32.0               compiler_3.6.0               
 [85] lsei_1.2-0                    dqrng_0.2.1                  
 [87] RColorBrewer_1.1-2            pcaMethods_1.78.0            
 [89] fitdistrplus_1.0-14           Rsamtools_2.2.1              
 [91] cli_2.0.1                     listenv_0.8.0                
 [93] pbapply_1.4-2                 MASS_7.3-51.5                
 [95] mgcv_1.8-31                   tidyselect_1.0.0             
 [97] stringi_1.4.5                 yaml_2.2.0                   
 [99] askpass_1.1                   locfit_1.5-9.1               
[101] ggrepel_0.8.1                 grid_3.6.0                   
[103] tools_3.6.0                   future.apply_1.4.0           
[105] rstudioapi_0.10               git2r_0.26.1                 
[107] gridExtra_2.3                 farver_2.0.3                 
[109] plyranges_1.6.6               Rtsne_0.15                   
[111] digest_0.6.23                 BiocManager_1.30.10          
[113] shiny_1.4.0                   Rcpp_1.0.3                   
[115] broom_0.5.4                   SDMTools_1.1-221.2           
[117] BiocVersion_3.10.1            later_1.0.0                  
[119] RcppAnnoy_0.0.14              httr_1.4.1                   
[121] npsurv_0.4-0                  Rdpack_0.11-1                
[123] colorspace_1.4-1              rvest_0.3.5                  
[125] XML_3.99-0.3                  fs_1.3.1                     
[127] reticulate_1.14               splines_3.6.0                
[129] uwot_0.1.5                    xtable_1.8-4                 
[131] jsonlite_1.6                  R6_2.4.1                     
[133] pillar_1.4.3                  htmltools_0.4.0              
[135] mime_0.8                      glue_1.3.1                   
[137] fastmap_1.0.1                 BiocNeighbors_1.4.1          
[139] interactiveDisplayBase_1.24.0 codetools_0.2-16             
[141] tsne_0.1-3                    lattice_0.20-38              
[143] curl_4.3                      leiden_0.3.2                 
[145] gtools_3.8.1                  openssl_1.4.1                
[147] survival_3.1-8                limma_3.42.0                 
[149] rmarkdown_2.1                 munsell_0.5.0                
[151] rhdf5_2.30.1                  GenomeInfoDbData_1.2.2       
[153] HDF5Array_1.14.1              haven_2.2.0                  
[155] reshape2_1.4.3                gtable_0.3.0